|
Copyright (C) 1999
Nonlinear
Dynamics Group at Heriot-Watt University and Computational Biology Group at University of Leeds

Nonlinear Analysis of
Ventricular Fibrillation

Analysis
of Pseudo-ECG Signals of Ventricular Tachyarrhythmias
R.H.
Claytona, Dejin Yub, M. Smallb, V.N.
Biktasheva, R.G. Harrisonb, A.V. Holdena
aComputational Biology Group at University of Leeds
bNonlinear Dynamics Group at Heriot-Watt University
This
is a combined analysis of nonlinear modelling, linear and nonlinear
techniques to understand complex dynamics in a model of re-entry,
undertaken between Leeds and Heriot-Watt groups. The aim of
this study was to compare pseudo-ECGs produced by different configurations
of re-entry in a computational model. We initiated single, double and
multiple re-entrant waves in a cuboid with Fitz-Hugh Nagumo excitability.
We estimated one component of the pseudo-ECG, and applied linear
time-frequency and non-linear dimensional analysis. The pseudo-ECG produced
by a single re-entrant wave was periodic, whereas that produced by a double
re-entrant wave was quasiperiodic with slow changes in both frequency
content and amplitude. The dimension of these time series was around 1 and
3 respectively. The time-frequency distribution of the pseudo-ECG produced
by multiple re-entrant waves was more complex with rapid changes in
frequency and amplitude, and the dimension of the pseudo-ECG time series
was around 4. Thus different configurations of re-entrant wave are
associated with qualitatively and quantitatively different pseudo-ECG time
series.
1.
Introduction
Despite considerable progress in recent years, the mechanisms of
ventricular fibrillation and polymorphic ventricular tachycardia in the
human heart remain poorly understood. One of the reasons for this is that
detailed information about action potential propagation in the in-situ
human heart is difficult to obtain, even when the heart is in sinus rhythm.
The body surface ECG is the most widely used clinical tool for assessing
arrhythymias, sometimes in conjunction with endocardial electrograms.
During VF and PVT the ECG resembles an irregular and disordered time
series, yet analysis of VF time series has revealed evidence of unexpected
order and structure.
Experimental and computational studies have shown that re-entry is a
candidate mechanism for many ventricular tachyarrhythmias, and some recent
work has shown that the pseudo-ECG produced by a re-entrant wave in a
computational model has striking similarities to the ECG of VF. In this
preliminary study we sought to quantitatively compare the pseudo-ECGs
produced by different configurations of simulated re-entrant wave.
2.
Methods
We simulated re-entrant waves in a numerical caricature of
myocardium. All simulations were computed in a cuboid 100 x 100 x 50
elements in size and with excitability described by Fitz-Hugh Nagumo
equations with a diffusion coefficient of 1, beta = 0.70, gamma = 0.50 and
epsilon = 0.30. The three dimensional cable equations were solved for the
excitation variable u and the recovery variable v with a time step of 0.03
time units and a space step of 0.50 space units. We simulated three
configurations of re-entrant wave. A single re-entrant wave was initiated
by partial block of a propagating plane wave. A double re-entrant wave was
also initiated by partial block of a plane wave. Multiple re-entrant waves
were initiated from a single twisted re-entrant wave which was allowed to
fragment. Isosurfaces of the u (excitation) variable for each of the three
simulations are shown in Figure 1(a)-(c).
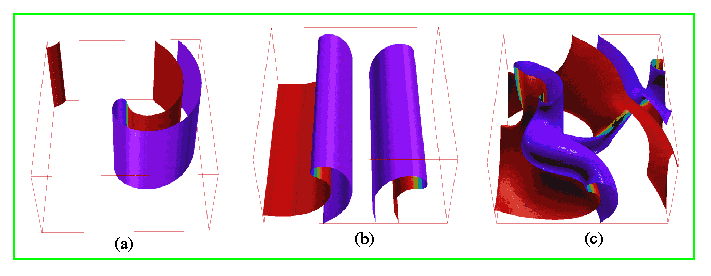
Figure 1. Snapshot of the u (excitation variable) isosurface for the
(a) single, (b) double and (c) multiple re-entrant
wave simulations.
We calculated the x component of the pseudo-ECG from the sum of the
weighted gradient in the excitation variable u along the x axis of the
simulation. We approximated the gradient as a simple difference, so the
pseudo-ECG was estimated as
ECGx = SUM (ux-1 -ux)/x
where the sum is taken over x = 2, 3, ..., 100.
We estimated the time frequency distribution (TFD) of each
pseudo-ECG time series using the smoothed Wigner algorithm.
We also applied non-linear analysis techniques to quantify each
pseudo-ECG time series. First we generated 20 surrogates of each time
series using the amplitude adjusted Fourier transform method. Each
surrogate had the same distribution of amplitudes and same power spectrum
as the original time series, but the phase of each spectral component is
randomised so the surrogate time series is linearly filtered random noise.
We then calculated the correlation integral and estimated the dimension of
both pseudo-ECG and surrogate time series using the Gaussian kernel
algorithm, which assumes that the time series has both high dimensional and
stochastic components.
3.
Results
The pseudo-ECG time series from each simulation are shown in Figure
2. The time series from a single rotating re-entrant wave is periodic and
stationary, reflecting the ordered rotation in this simulation. During the
simulation with two re-entrant waves, the cores slowly orbited around a
central point, and this is reflected in slow changes in the amplitude of
the pseudo-ECG time series. The time series from multiple re-entrant waves
is much more complex, and qualitatively resembles the ECG of VF.
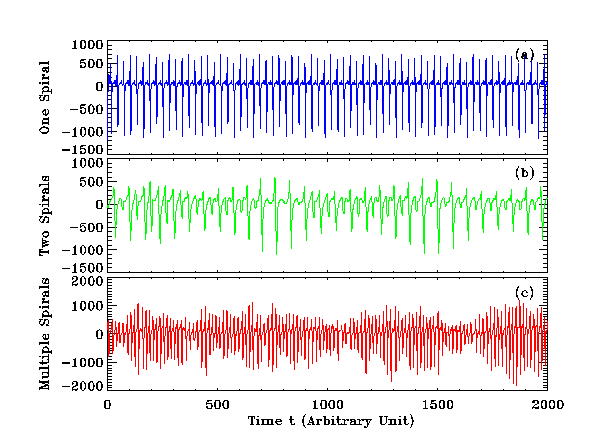
Figure 2: Pseudo-ECG time series from a single re-entrant wave
(top), two re-entrant waves (middle) and multiple re-entrant waves
(bottom).
The TFDs of the time series shown in Figure 2 are depicted in Figure
3. These plots emphasise the graduation from periodic characteristics with
one re-entrant wave, through quasiperiodicity with two re-entrant waves,
and rapid changes in the amplitude and frequency of the pseudo-ECG
components with multiple re-entrant waves.
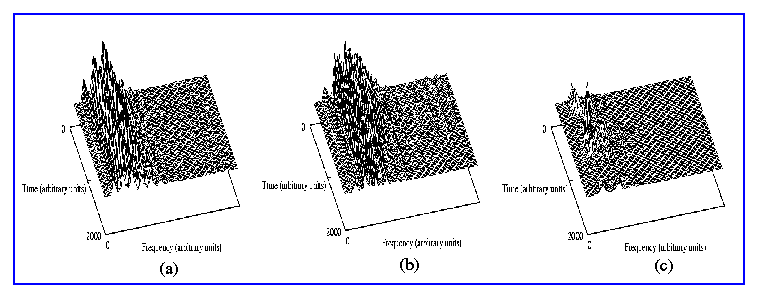
Figure 3: Time frequency distribution for pseudo-ECG signals from
one (top), two (middle), and multiple (bottom) re-entrant waves.
Figure 4 shows correlation integral plots for each simulation at an
embedding dimension of 8. In each case the difference between the surrogate
and pseudo-ECG time series increased with increasing embedding dimension up
to a maximum value. The difference between the real and surrogate time
series was significant, indicating that none of the pseudo-ECG time series
could be described as linearly filtered random noise.
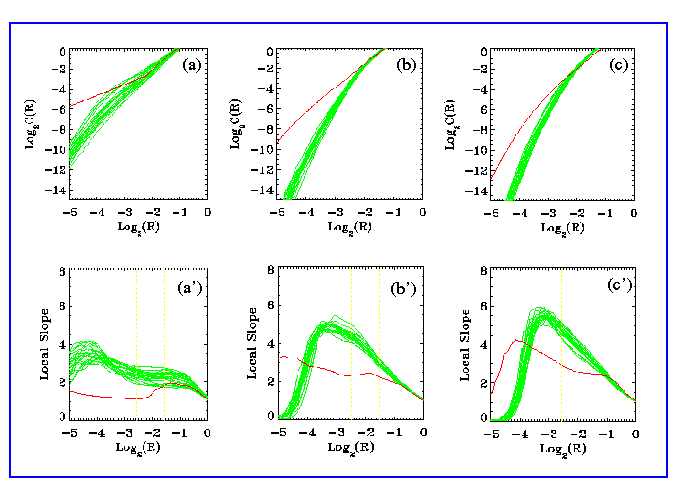
Figure 4: Plots of correlation integral against correlation length
for (a) (a') one, (b) (b') two and (c) (c') multiple re-entrant waves. The
bunched lines are correlation integral of the 20 surrogate time series, and
the single line is the correlation integral of the pseudo-ECG time series.
Plots of dimension and high dimenasional component as a function of
embedding dimension are shown in Figure 5. The dimension converged to
around 1 for a single re-entrant wave, around 3 for two re-entrant waves,
and around 4.5 for multiple re-entrant waves. The high dimenasional
component was around 10% for multiple re-entrant waves, and close to zero
for the other two simulations.
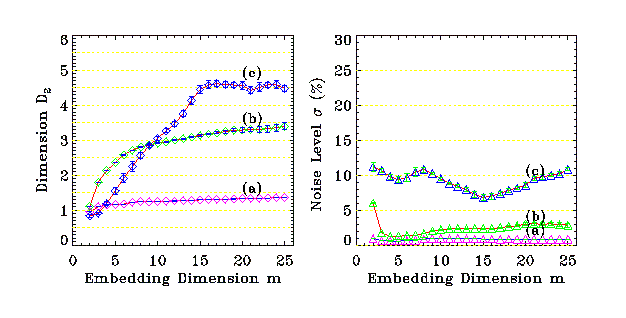
Figure 5: Dimension (left) and high dimenasional component (right)
plots for (a) one, (b) two and (c) multiple re-entrant waves.
4.
Discussion
This study has shown that different configurations of re-entrant
wave produce pseudo-ECG time series that are qualitatively and
quantitatively different.
Non-linear analysis is a promising technique for the analysis of
time series. The estimates of dimension in this study reflected the
increasing number of active degrees of freedom in the simulations, although
the estimate of dimension obtained for multiple re-entrant waves was less
than the value of 5-6 obtained from recordings of VF in pigs (5-6). The
most likely explanation for this difference is another level of complexity
imposed by more complex geometry, excitability, and action potential
propagation than the simple caricature presented here.
Nevertheless, this study has indicated the potential offered by the
combination of non-linear analysis, computational models of re-entry, and
real ECG data to expand our understanding of re-entry in real hearts. This
study complements a recent report that shows how re-entrant and focal
arrhythmias could be distinguished from their electrograms. Further work
will use more biophysically accurate computations using more realistic
ventricular geometry for propagation and a simulated torso for ECG
computations.
5.
Conclusions
In this study we have shown that the pseudo-ECG produced by single,
double, and multiple re-entrant waves in a numerical caricature of
myocardium have different linear and nonlinear properties.
Back to Research Reviews' Page
|